

Value stream mapping is a lean method that shows exactly where lead time and waste pile up between order and delivery, so teams can target the handoffs and delays that actually slow work down. Done well, it produces a clear before-and-after picture, measured in lead time and process-cycle efficiency, not just a wall chart. The rest of this guide walks through how to build one and, more importantly, how to make it stick.
TL;DR:
- Value stream mapping reveals that most elapsed time in processes is often spent waiting, not actively working, with typical process-cycle efficiency around single digits.
- Accurate mapping requires direct observation of at least five cycles per step in the actual process, not relying on outdated procedures or memory.
- Building a current-state map with sticky notes during a workshop ensures real engagement, helping to identify genuine inefficiencies and variations.
- Future improvements should be assigned clear owners, deadlines, and prioritized as quick wins, medium-term, or long-term projects to sustain progress.
- Maintaining ongoing measurement of lead time, process cycle efficiency, and WIP at key queues with regular reviews is essential to prevent maps from being ignored post-workshop.
Table of Contents
- What Is Value Stream Mapping and Why Does It Matter?
- When Should You Use Value Stream Mapping?
- What Symbols and Data Do You Need to Collect?
- How Do You Run a VSM Workshop From Start to Finish?
- How Do You Turn the Future State Into Real Projects?
- What Mistakes Undermine VSM Projects, and How Do You Avoid Them?
- What Does a Worked VSM Example Look Like?
- Should You Map by Hand or Use Digital VSM Software?
- How Do You Get Cross-Functional Teams Aligned in a VSM Workshop?
- Execution matters more than the map
- How Strategy Haus Helps You Execute on What Your VSM Reveals
- Sources
- FAQ
What Is Value Stream Mapping and Why Does It Matter?
Value stream mapping is a visual method for tracing how material and information move from a supplier through your process to a customer. It started inside the Toyota Production System, where teams needed a way to see waste that spreadsheets and process diagrams couldn't show.
The key distinction is scope. Most process documentation looks at one station or one department. A value stream map looks at the whole chain, every handoff, wait, and approval that happens between a customer's request and its delivery. That matters because fixing one station in isolation often just moves the bottleneck somewhere else. A lean value stream view forces you to optimize the flow, not the individual link.
You'll see VSM used across very different settings:
- Manufacturing floors, tracking parts from raw material to shipment
- Service and administrative workflows, like contract approvals or onboarding
- Healthcare, mapping patient flow from intake to discharge
- Software teams, tracing a feature from request to deployment
- Back-office functions, where "inventory" is really a stack of unprocessed requests
The process item changes by industry. The underlying question does not: where does time actually go?
When Should You Use Value Stream Mapping?
VSM earns its time investment when a process crosses multiple hands and the lead time feels longer than it should. If a request touches three or more teams before it's done, or if nobody can say with confidence how long the whole thing takes from start to finish, that's your signal.
The benefits show up fast once you have real data instead of assumptions:
- It exposes waiting time and work-in-progress that nobody was tracking
- It separates process time from lead time, so you know exactly how much delay is hiding in queues
- It tells you where to focus improvement effort instead of guessing
In practice: value stream analysis frequently uncovers that most elapsed time is waiting, not working. A timeline built from real observation often shows single-digit process-cycle efficiency, meaning the vast majority of the lead time is sitting in a queue.
If you're only documenting a single step for a training manual, skip VSM and use a simpler flowchart instead. VSM is worth the workshop hours when handoffs, not individual task speed, are the real problem. Teams that use it well typically report shorter lead times, fewer redundant approvals, and better coordination across departments that used to blame each other for delays.
What Symbols and Data Do You Need to Collect?
VSM uses a small, standardized set of symbols, and that's on purpose. A map cluttered with custom icons stops being readable by anyone outside the room that built it.
The core symbols you'll actually use:
- Process box: a single step or workstation
- Inventory triangle: a queue or stockpile of work waiting between steps
- Straight arrows: physical movement of material or product
- Dashed or jagged arrows: information flow, like orders or schedules
- Kanban and supplier/customer icons: signals and the endpoints of the value stream
Each process box gets a data box underneath it, and this is where the map earns its credibility. At minimum, record:
- Cycle time (how long one unit takes at that step)
- Changeover time (setup time between different products or requests)
- Uptime or availability
- Batch size and number of operators
- WIP quantity sitting in the queue
Once you have that data, you build a timeline beneath the whole map. It separates process time (actual work) from lead time (total elapsed time, including waiting). Dividing process time by lead time gives you Process Cycle Efficiency, a single number that tells you how much of your total time is spent actually adding value versus sitting idle.
How Do You Run a VSM Workshop From Start to Finish?
Building a usable map is a sequence, not a single meeting. Skip a step and the map you end up with will look convincing but tell you nothing useful.
-
Define scope before you schedule anything. Pick one product family or request type with a consistent routing. Mixing products with wildly different paths through the process creates a map too tangled to act on. Note customer demand, or takt time, so you know the pace the process actually needs to hit.
-
Assemble the right room. Six to ten people works well: frontline staff who actually do the work, a supervisor, and someone from each function the process touches. Leaving out frontline staff is one of the fastest ways to end up with a map built on assumptions instead of reality.
-
Walk the process at the gemba, backward from the customer. Start at delivery and trace back to the supplier, timing at least five cycles per operation rather than relying on what people remember. Record actual cycle times and actual queue times, not the times written in a procedure manual from three years ago.
-
Build the current-state map with the team. Place process boxes in sequence, add inventory triangles at each queue, and draw the information flows above the process line. Fill in every data box with what you actually observed, then draw the timeline and calculate total process time, total lead time, and PCE.
-
Design the future state. Ask where you can introduce pull instead of push, where flow could replace batching, and where the process could run closer to takt. Mark kaizen bursts, small starbursts on the map, at each point where a specific improvement is planned.
-
Validate and convert bursts into projects. Review the map with both the operators who do the work and the leaders who control resources. Every kaizen burst needs an owner, a deadline, and a defined resource commitment before the workshop ends.
Pro Tip: Build the current-state map with sticky notes, not software, during the workshop itself. Paper lets the whole room move boxes and argue over sequencing in real time, which surfaces disagreements about "how it actually works" that a polished digital map tends to hide.
How Do You Turn the Future State Into Real Projects?
Most VSM efforts don't fail at the mapping stage. They fail after the workshop, when the map gets photographed, filed, and forgotten. Learning to See points to a consistent pattern: maps without committed follow-through rarely change anything, because insight without ownership just becomes a nice-looking diagram on a shared drive.
Avoiding that starts with leadership actually attending the validation review, not just the kickoff. Every kaizen burst needs a named owner and a real deadline, not a vague "someone should look at this."
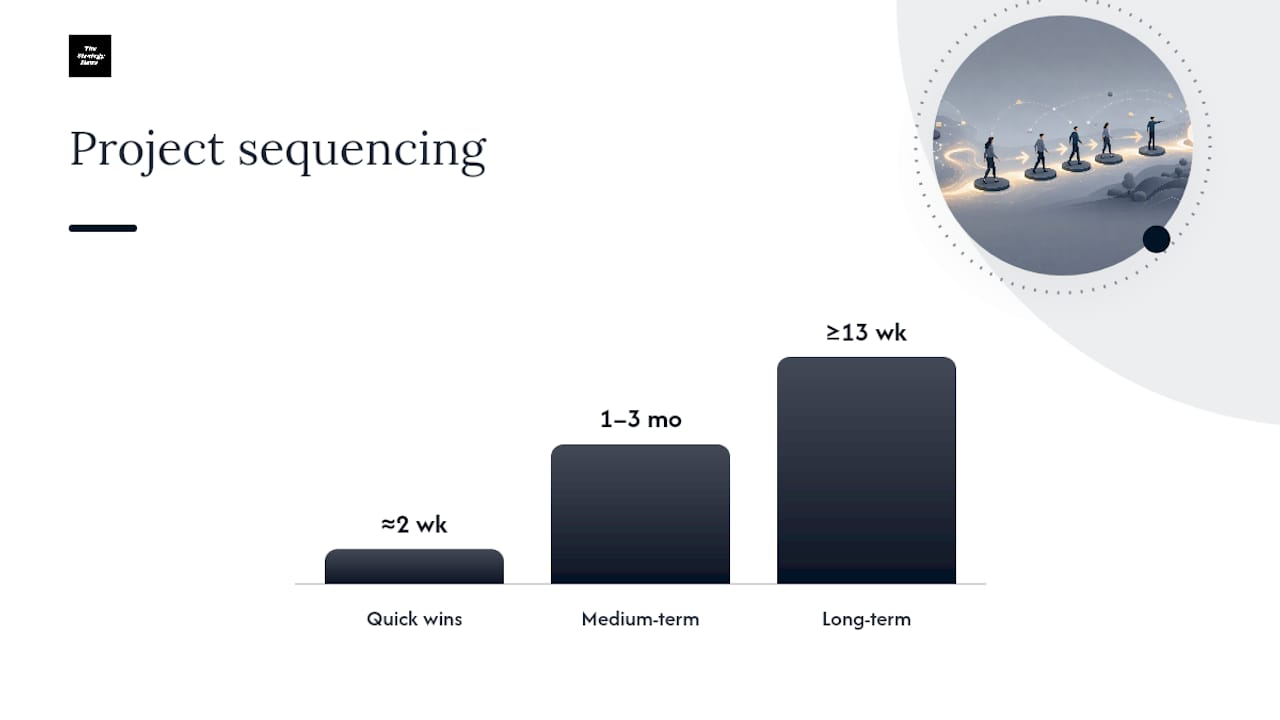
Sequence the work by effort and payoff:
- Quick wins (days to a few weeks): fixing an obvious approval bottleneck, eliminating a redundant sign-off
- Medium-term (one to three months): rebalancing workload across a queue, restructuring a handoff between two teams
- Long-term (a quarter or more): equipment changes, system integrations, or organizational restructuring
| Metric | What it tells you | Review cadence |
|---|---|---|
| Lead time | Total elapsed time, order to delivery | Weekly during active improvement |
| Process Cycle Efficiency | Share of lead time that's actual value-added work | Monthly |
| WIP at key queues | Whether bottlenecks are shrinking | Weekly |
A steering group that checks these numbers on a fixed cadence, not just at project close, is what separates a map that changes outcomes from one that gets referenced once and never again. Teams that plan for implementation support from the outset tend to hold that cadence longer than teams that treat the workshop as the finish line.
What Mistakes Undermine VSM Projects, and How Do You Avoid Them?
The biggest recurring failure is what practitioners call the conference-room trap: building a map from memory or from an outdated procedure instead of walking the actual process. A map built this way looks legitimate and is often wrong in ways nobody notices until an improvement fails to deliver.
Other common pitfalls:
- Scoping the map too broadly, covering multiple product families with different routings in one session
- Excluding frontline staff, which produces a map that reflects management's theory of the process rather than reality
- Skipping timed observation in favor of "we all know how long that takes"
A short field checklist helps workshop leads stay disciplined:
- Before the workshop: confirm scope, pull customer demand data, book six to ten cross-functional participants
- During the workshop: time at least five cycles per step, capture every data box field, keep the symbol set to the standard handful
- After the workshop: assign an owner and deadline to every kaizen burst, schedule the follow-up review
Pro Tip: If two people in the room disagree about how long a step actually takes, that disagreement is data. It usually means the process runs inconsistently, and that variation deserves its own line item on the future-state plan.
What Does a Worked VSM Example Look Like?
Take a simple invoice approval process: request submitted, manager review, finance check, payment release. A current-state walk might find 45 minutes of total processing time spread across four steps, but a lead time of several days because the invoice spends significant time waiting in queues, including in the manager's and finance queues.
- Kaizen burst one: set a 24-hour SLA on manager review, with the requester's supervisor as backup approver. Owner: department lead. Timebox: two weeks to implement and monitor.
- Kaizen burst two: batch finance checks daily instead of weekly, reviewed by the finance manager. Timebox: three weeks, including one cycle of testing.
Applied together, those two changes could plausibly cut the six-day lead time down to a day and a half, since most of that six days was queue time, not actual work. The metric worth tracking after implementation isn't processing time. It's lead time and PCE, since those numbers reveal whether the queue actually shrank or just moved somewhere else in the process.
Should You Map by Hand or Use Digital VSM Software?
Paper and sticky notes remain the standard for the first current-state build, and there's a practical reason beyond nostalgia: a physical map is easy to argue with. Anyone in the room can move a box, add a queue, or challenge a cycle time on the spot, which is exactly the kind of friction a good VSM workshop needs.
Digital tools earn their place after that first draft exists. Software versions of VSM let you store maps centrally, update them as improvements land, and share a current version across sites or shifts without a photo of a whiteboard circulating in email threads. For distributed teams working across time zones or with offshore operations, a digital map is often the only practical way to keep everyone looking at the same version of the process.
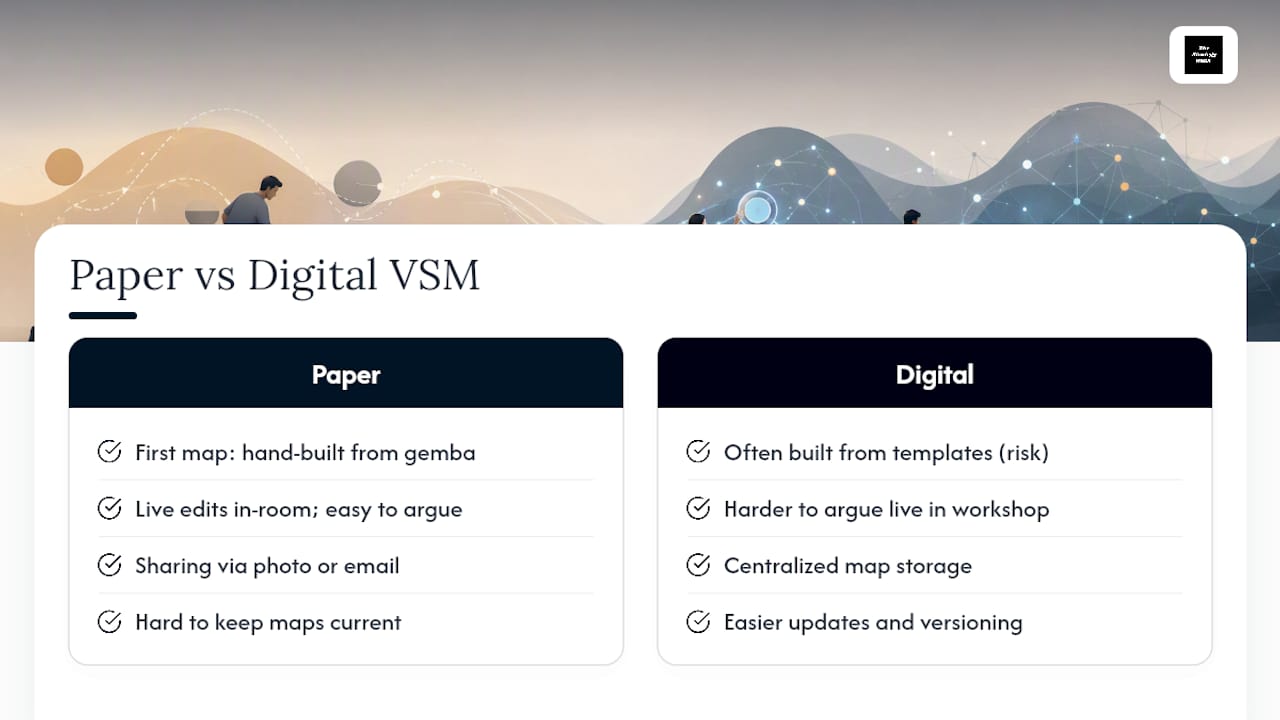
The tradeoff is real, though. Digital tools can make it too easy to build a map from a template instead of from a gemba walk, which reintroduces the conference-room trap in a different form. The rule that holds regardless of medium: build the first current-state map from direct observation, then decide whether to digitize it for maintenance and version control. Software doesn't replace the walk. It just makes the result easier to keep current once the walk is done.
How Do You Get Cross-Functional Teams Aligned in a VSM Workshop?
A value stream map that only includes one department's perspective will miss the handoffs that cause the most delay, since those handoffs by definition involve more than one team. Getting genuine alignment starts with who's in the room, not what's on the wall.
Invite people who do the work, not just people who manage it. A supervisor can describe a process; only the person running it daily knows where it actually breaks down. Set a shared ground rule early: the map reflects what happens, not what the procedure says should happen. That single agreement prevents a lot of quiet defensiveness once queue times and rework start showing up on sticky notes.
Facilitation matters as much as attendance. A workshop that runs four or five hours needs structured breaks and a facilitator who keeps the group moving from observation to mapping to timeline math without letting any one function dominate the conversation. Techniques borrowed from structured workshop facilitation, like timeboxing each mapping phase and using visual voting for prioritizing kaizen bursts, keep a mixed group of engineers, managers, and frontline staff engaged instead of checked out by hour three.
End every session with each function naming its own commitment, not a vague group agreement. When finance, operations, and customer service each leave with a specific action tied to their name, the future-state map has a much better chance of surviving contact with next week's priorities.
Execution matters more than the map
The maps I've seen fail weren't badly drawn. They were accurate, detailed, and completely ignored six weeks later because nobody owned the follow-through.
If your organization needs help holding that follow-through, Strategy Haus builds execution plans specifically for that gap.
— Ashanti
How Strategy Haus Helps You Execute on What Your VSM Reveals
Running a VSM workshop is the easy part. Turning kaizen bursts into scheduled projects with real owners, without the effort stalling after everyone goes back to their day jobs, is where most teams need help. Some consulting firms focus on exactly that gap: not just planning the future state, but building the systems and follow-through that get it implemented.
Engagements typically start with a workshop to validate your current and future-state maps, followed by implementation sprints that assign owners, deadlines, and resources to each kaizen burst. From there, Thestrategyhaus helps set up the operational systems, templates, and tracking cadence needed to sustain the change so your lead-time and process-cycle-efficiency gains don't quietly reverse three months later. If your value stream map is sitting in a folder waiting for someone to act on it, work with us to turn it into a scheduled project instead.
Sources
- Value Stream Mapping (Lean Enterprise Institute)
- Value Stream Mapping: How to Map and Improve a Process (Rework Resources)
- Value stream mapping (ASQ)
FAQ
What Is the Concept of Value Stream Mapping?
Value stream mapping is a visual method for tracing material and information flow from supplier to customer, used to find and remove waste along the way. It looks at the entire process chain rather than a single station, which is what separates it from a standard flowchart.
What Are the Four Steps of Value Stream Mapping?
The core sequence is scoping the product family, walking the process at the gemba to build the current-state map, designing a future-state map with kaizen bursts, and converting those bursts into implementation projects with owners and deadlines. Some practitioners split this into more granular stages, but those four phases cover the method end to end.
Is VSM Lean or Six Sigma?
Value stream mapping is a lean tool, developed within the Toyota Production System, rather than a Six Sigma technique. Some organizations blend it into Lean Six Sigma programs, but its origin and core logic (flow, waste, and gemba observation) are lean concepts.
How Do I Create a Value Stream Map?
Start by defining a single product family with consistent routing, then walk the process backward from the customer, timing at least five cycles per step rather than relying on memory. Fill in data boxes for cycle time, changeover, and uptime, then draw a timeline separating process time from lead time to calculate your baseline efficiency.