

A sales process map is a one-page visual blueprint of the stages, owners, decision rules, and typical durations that show how deals actually move and where they stall. It reveals handoff failures between marketing and sales, exposes stages where reps quietly bend the rules, and gives forecasting the structural integrity it usually lacks.
The best first move isn't a whiteboard session. It's a records pull.
- Grab a representative sample of recent closed-won and closed-lost deals from the CRM and lay out the dated events for each.
- Or, if that data is messy, block 90 minutes for a mapping workshop focused on a single workflow, not your entire pipeline.
Either path gets you to the same place: a map built on what happened, not what your team believes should happen.
Key Takeaways
A sales process map only improves forecasting and coaching when it's built from closed-deal records first and then enforced through required CRM fields, not left as a static diagram.
| Point | Details |
|---|---|
| Build from records, not memory | Extract dated events from 20 closed-won and 20 closed-lost deals before running any workshop. |
| Name every exit separately | Track disqualified and no-decision as distinct outcomes since they signal different problems. |
| Use buyer-observable exit criteria | Base stage advancement on what the buyer said or did, not on rep belief. |
| Pilot before rolling out | Test one workflow with one team for 30 to 60 days with weekly audits before scaling. |
| Change the map at period boundaries only | Update mid-quarter and you lose the ability to compare conversion rates over time. |
| Get execution support from Thestrategyhaus | Thestrategyhaus wires stage definitions and required fields into your CRM so the map drives behavior, not just documentation. |
Table of Contents
- What Is Sales Process Mapping, Exactly?
- Why Does Sales Process Mapping Matter for Revenue Teams?
- What Are the Common Sales Process Map Formats?
- How Do You Build a Sales Process Map Step by Step?
- How Do You Operationalize the Map With Strategy Haus's Execution Framework?
- What Metrics Keep a Sales Process Map Alive?
- What's the Real Gap Between Mapping Theory and Mapping Practice?
- Getting Help Turning Your Map Into a Working System
- Sources
What Is Sales Process Mapping, Exactly?
Sales process mapping is the practice of documenting each stage a deal passes through, from first contact to closed-won, closed-lost, or no-decision, along with who owns each stage and what has to be true before a deal moves forward. It's different from a CRM stage list, which is usually just labels with no rules attached, and it's different from a 40-page playbook, which nobody reads on a Tuesday between calls.
A usable map has five components that most first drafts skip:
- Entry criteria: what must be true for a deal to land in this stage.
- Owner: the specific role (not "sales") responsible for moving it forward.
- Exit criteria: buyer-observable proof the deal is ready to advance, not a rep's gut feeling.
- Median duration: how long deals typically sit here, based on actual history.
- Every named exit: won, lost, disqualified, and no-decision, tracked as separate outcomes.
Exit criteria matter more than most teams realize. Inveo's sales process design guidance makes the case that exit criteria should be based on what the buyer said or did, not what the rep claims happened, because seller-reported progress is exactly where forecast accuracy falls apart.
On format: a flowchart works for a simple, linear motion. A swimlane diagram works when multiple teams touch the deal. Pick the format that matches your actual complexity, not the one that looks best in a slide deck.
Why Does Sales Process Mapping Matter for Revenue Teams?
A map isn't a documentation exercise. It's a diagnostic tool that changes how you coach, forecast, and onboard.
When you can see exactly where deals stall, coaching conversations shift from "how's your pipeline" to "why are three deals stuck at demo for 40 days when your median is 12." That specificity is what actually changes rep behavior. HubSpot Academy's mapping lesson ties this directly to playbook creation: once stages have real definitions, you can build coaching content around each one instead of generic advice that applies to nobody's actual deal.
Forecast accuracy improves for a simpler reason: a map exposes which stages have soft, seller-claimed exit criteria versus which have hard, buyer-observable proof. Deals sitting in a stage with weak criteria are the ones that "definitely close this quarter" and then don't.
- Bottleneck visibility replaces guesswork about where deals die.
- New hires ramp faster because the process is a picture, not a paragraph.
- Handoffs between marketing, sales, and customer success stop leaking deals silently.
Pro Tip: If you only fix one thing this quarter, fix the stage with the widest gap between average duration and median duration. That gap is where outliers are quietly wrecking your forecast.
The catch: a map only delivers these outcomes if it's wired into your systems. A map living in a slide deck nobody opens delivers nothing.
What Are the Common Sales Process Map Formats?
Three formats cover almost every use case, and picking the wrong one is the most common reason maps get built once and never touched again.
The one-page flowchart works when you need executive-level clarity fast. It's linear: lead in, stages across, outcomes at the end. Use it when your process genuinely has one path and you're mapping for visibility, not operational detail.
The swimlane map adds horizontal lanes for each team or role touching the deal, sales, solutions engineering, legal, customer success. Use it the moment more than one department has a handoff responsibility, because a flowchart alone hides exactly where those handoffs break.
The 5-box workflow is the most useful format for repeatable, signal-driven steps. Each box names a Trigger, an Action, a Decision, a Handoff, and an Outcome. According to Gangly's workflow mapping guide, this structure forces timing, ownership, and decision rules to become explicit instead of implied, and a focused workshop can produce a usable first draft in a single sitting.
- Choose the flowchart for leadership visibility and simple, linear motions.
- Choose swimlanes when handoffs cross department lines.
- Choose the 5-box workflow when mapping a specific, repeatable motion like lead qualification or contract routing.
Most teams use a combination of these formats tailored by audience: a CEO prefers the flowchart, a RevOps lead the swimlane, and frontline managers detailed 5-box views.
How Do You Build a Sales Process Map Step by Step?
The biggest mistake in sales process mapping is starting with a whiteboard and everyone's memory. Memory is unreliable, and reps consistently describe the process they intended to follow, not the one that actually happened. Build from records first, then validate with people.
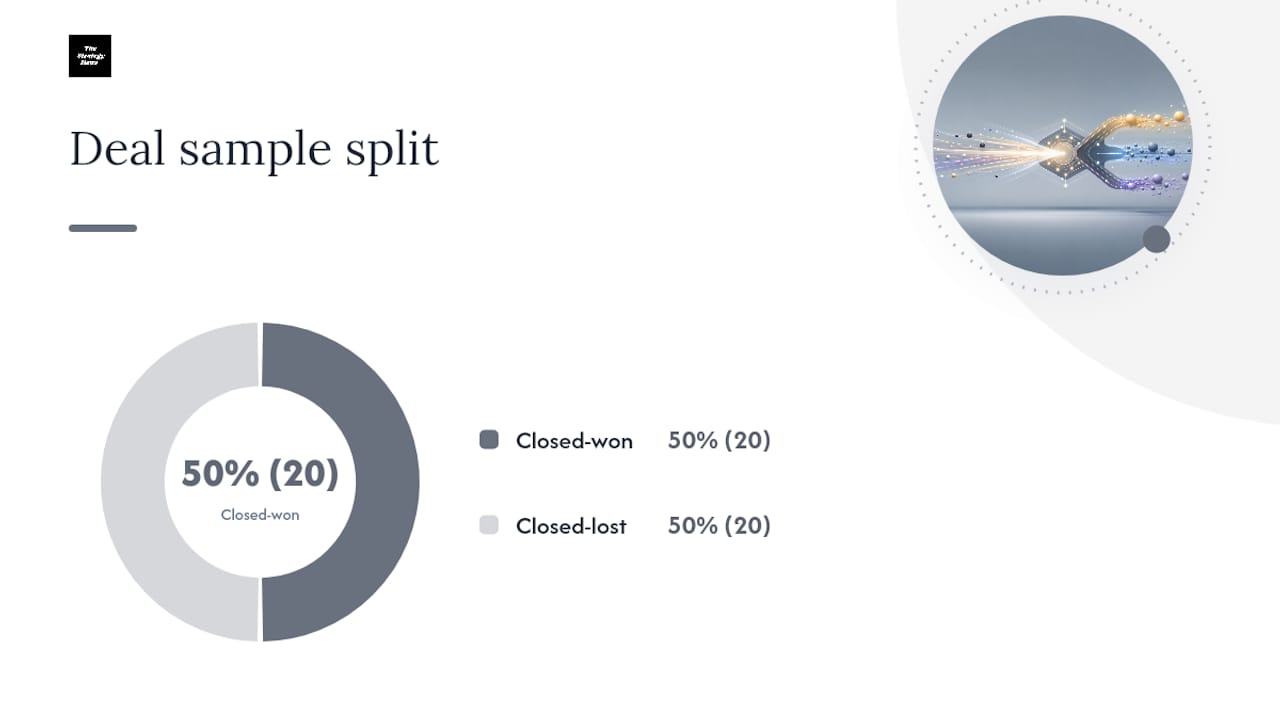
1. Extract the data. Pull your last 20 closed-won and 20 closed-lost deals from the CRM. For each one, record every observable event and its date: first contact, discovery call, proposal sent, contract sent, signature. According to RevenueFlow's guidance on process mapping, this records-first approach captures what actually happened rather than what the team believes should happen, and interviews should only fill gaps the data can't show.
2. Interview around specific deals, not generalities. Instead of asking "what's our sales process," ask "walk me through what happened on the Acme deal between the demo and the contract." Specific deals surface the recorded process versus the remembered one, and the gap between those two is usually where your real problems live.
**3. Map it. A map that only shows the idealized journey is fiction with a nice layout.
4. Name owners for every stage. Not "sales team." A specific role. If ownership is genuinely shared, say so explicitly and note the handoff trigger.
5. Set median durations from the data, not from targets. Your median discovery-to-proposal time might be 9 days when your target is 5. Map the real number. The map's job is diagnosis, not aspiration.
6. List every exit, including the ones people avoid tracking. Won and lost are obvious. Disqualified and no-decision get lumped together constantly, and that's a mistake. LLR Partners' pipeline definitions guidance points out that disqualified deals signal a targeting problem, while no-decision deals usually signal a missing buyer forcing function. Conflate them and you lose the diagnostic value entirely.
7. Design the future state only after the current state is drawn. Annotate the deltas directly on the map: this step gets cut, this owner changes, this exit criteria tightens. Date the new version and re-check open deals against it so nothing falls through during the transition.
Workshop deliverables should be concrete, not aspirational:
- A one-page current-state map labeling every observed path, owner, and median duration.
- A one-page future-state map annotating changes against the current state.
- A concise list of stage definitions suitable for CRM field descriptions.
- A named owner accountable for each stage who approves the final version.
| Step | Deliverable |
|---|---|
| Data extraction | Event list from sampled wins and losses |
| Interviews | Notes on discrepancies between recorded and remembered processes |
| Current-state draw | One-page map with all observed paths |
| Future-state design | Annotated deltas with versioning |
How Do You Operationalize the Map With Strategy Haus's Execution Framework?
A finished map that lives in a slide deck changes nothing. The map has to become the thing your CRM actually enforces, and that's where most mapping projects quietly die.

Start by embedding your stage definitions and exit criteria directly into the CRM, not as a linked document but as field-level descriptions reps see when they open a deal. VEN Studio's documentation guidance makes the point plainly: process definitions that live outside the CRM get ignored the moment reps are busy, which is always. Required fields at stage transitions, next-step date, exit criteria met, owner confirmed, turn the map from a reference document into a gate deals can't skip.
Pilot with one workflow and one team before rolling out everywhere. Run weekly audits against the map for 30 to 60 days, checking whether reps are actually meeting exit criteria or just clicking through stages. Iterate the map based on what those audits surface, not based on a single stakeholder's opinion.
- Wire stage descriptions and required fields into CRM stage transitions.
- Pilot with one team, audit weekly, and hold the pilot for 30 to 60 days minimum.
- Track the measurement set: percentage of records with a next step, median days-in-stage, stage conversion rate, and the disqualified versus no-decision split.
- Assign map ownership to one accountable person and set a change-control rule.
Pro Tip: Change the map only at period boundaries, quarter start or fiscal year start, and always map old stage names to new ones. A map that changes mid-quarter breaks every comparison you'd otherwise make.
The map works as both a description of reality and a measuring instrument at the same time. Change it carelessly and you lose the ability to compare this quarter's stage conversion to last quarter's, which defeats the entire point of tracking it.
What Metrics Keep a Sales Process Map Alive?
A map without metrics is a poster. The practices that keep it operational are small and unglamorous, but they're what separates a map teams actually use from one that gets built once for a QBR deck.
Keep every workflow map to one page. Gangly's guidance on workflow artifacts is direct on this: a one-page map gets edited the moment reality breaks the pattern, while a long documentation-style version just ages quietly on a shared drive until nobody trusts it.
Enforce a next-step requirement on every active record. No deal should sit in your pipeline without a dated, owned next action. Keep required fields minimal, three or four per stage transition, because CRM fatigue kills adoption faster than a badly drawn map ever will.
Four metrics deserve a permanent home on your dashboard:
- Percentage of records with a next-step field completed, your cleanest adoption signal.
- Median days-in-stage, tracked separately from the average, since averages hide outliers that skew forecasting.
- Stage-to-stage conversion rate, watched over time rather than as a single snapshot.
- Disqualified versus no-decision split, kept as two distinct categories because, per LLR Partners' analysis, collapsing them into one bucket erases the difference between a targeting problem and a missing forcing function.
Review these weekly during your pilot phase, then monthly once the map stabilizes. Update the map itself at fixed intervals, not whenever someone has a strong opinion in a meeting.
What's the Real Gap Between Mapping Theory and Mapping Practice?
Most advice on sales process mapping treats it as a workshop deliverable: get the team in a room, draw boxes on a whiteboard, print the poster. That approach produces a map of what people remember doing, filtered through whatever they'd like to believe about their own performance. It's not dishonest. It's just unreliable, and unreliable inputs produce a map that looks authoritative and isn't.
The stronger method starts with records, not memory: pull 20 wins and 20 losses, extract the dated events, and let the workshop validate gaps in the data rather than invent the whole process from scratch. That single sequencing change is what separates a map people trust from one they quietly ignore three weeks later.
The part conventional advice skips almost entirely is what happens after the map is drawn. A finished map that isn't wired into CRM fields and required stage-transition data is a poster with good intentions. Execution, not the drawing exercise, is where mapping projects actually succeed or fail. If you're only going to do one thing well, do the records pull honestly and then force the definitions into your systems where reps can't skip them.
— Ashanti
Getting Help Turning Your Map Into a Working System
Wiring stage definitions into your CRM, running a 30 to 60 day pilot, holding weekly audits, and getting a reluctant sales team to actually use required fields is the hard 80%, and it's the part where most mapping projects quietly stall.

Thestrategyhaus specializes in exactly this gap. Rather than handing you a strategy deck and wishing you luck, Thestrategyhaus builds the operational systems, CRM configuration, required-field logic, and governance cadence, that make a sales process map function as a real operating system instead of a slide someone made once for a leadership review. If your team has a map that isn't changing behavior, or you need one built from your own closed-deal records and then implemented properly, Strategy Haus's business strategy and project management services are built for that execution phase specifically. It's also worth pairing this work with how your sales output flows into finance: quote-to-cash workflows show how validated handoffs downstream depend on the same clean stage definitions you're building upstream. Reach out to Thestrategyhaus to scope a pilot workflow and get a working system in place within your next quarter.
Sources
- Sales Process Mapping: Draw What Happens, Not What Should | RevenueFlow
- Sales Workflow Mapping: The Step-by-Step Guide for 2026 — Gangly Blog
- Sales Process Mapping - HubSpot Academy